Visualization of logs
Last modified Apr 20, 2023
All logs statements from a service that is written to standard out are collected by promtail and send til Loki. The logs can then be visualized in Grafana.
The retention period for logs are 14 days. This means that logfiles older than 14 days are automatically deleted. If there are special needs retention periods these can be configured on request.
Grafana will provide a standard dashboard for searching logfiles.
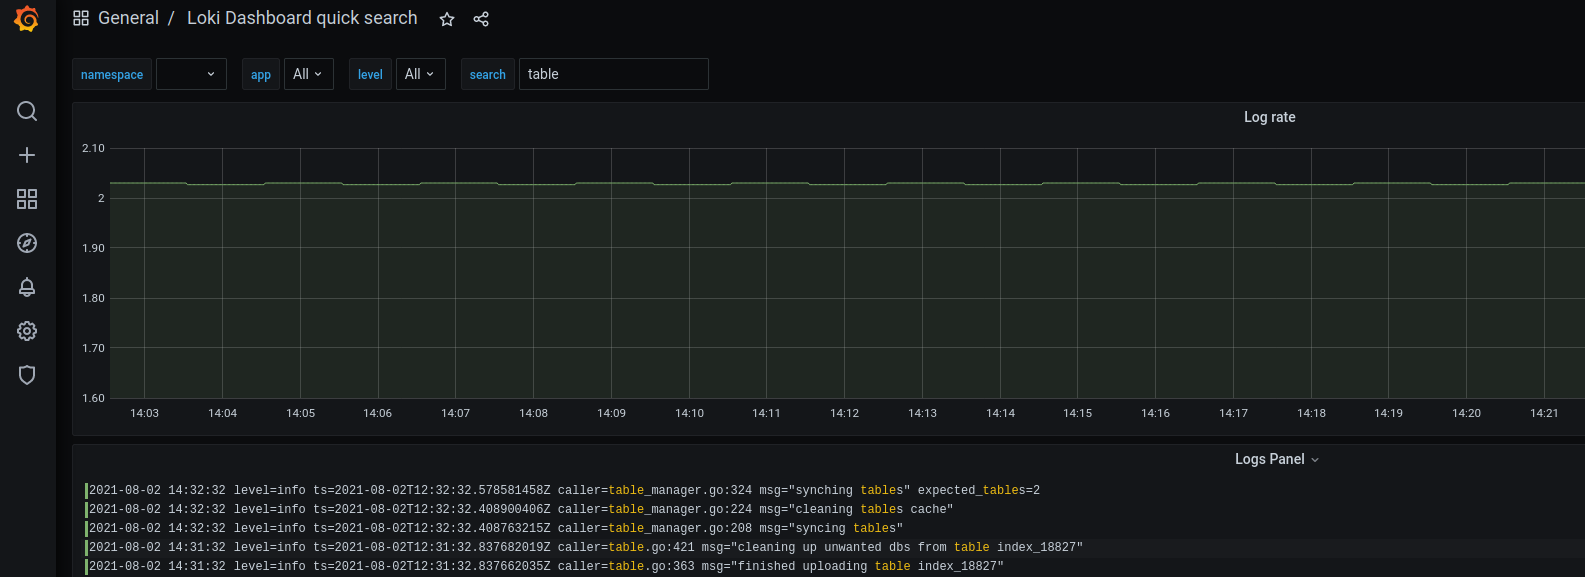
The dashboard Loki Dashboard quick search has search fields, for easy filtering of logs:
- Namespace, if you have multiple tenants you can filter between the namespaces.
- App, is name of the service you investigate logs
- Level, it is possible to filter on loglevel.
- Search, here you can make a text search that will match the logstatements.
Grafana provides at standard explorer. In the explorer you can search data from Loki (and prometheus). The explorer can be used when designing new dashboards to see log data available.
To search for logs directly in Loki use LogQL which is Loki’s own language for querying logs.
Find logs for app Loki where error occurs in log can be expressed like : {app=“loki”} |= “error”
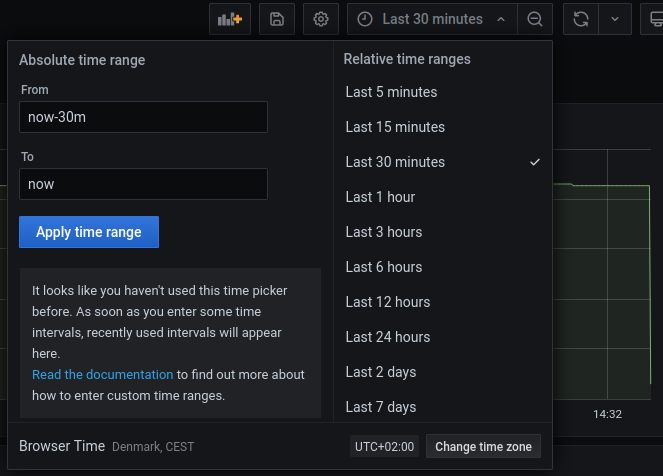
It is possible to filter logs in the top right corner based on relative and absolute time ranges.